


Introduction:
Cognos Analytics on CP4D with Maximo Application Suite is a wondrous fusion of technological brilliance and business analytics excellence. Powered by latest and greatest Watson AI, Cognos allows users to effortlessly analyze complex data sets and unlock actionable insights hidden within their data.
With a simple conversation in natural language with Cognos Assistant, end users can create captivating reports and interactive dashboards that bring data to life.
Prepare to be astounded by the seamless synergy of Cognos Analytics and Maximo Application Suite, making data exploration an elegant and enlightening experience.
The platform's AI-driven data exploration enables users to automatically create visualizations that best represent their data, saving time and effort.
IBM Cognos Analytics with Maximo Application Suite can revolutionize reliability and asset maintenance, helping organizations achieve higher levels of efficiency, productivity, and cost savings.
In this blog, we will explore one of the features of Cognos self-service analytics, “Exploration”.
Setup:
Cognos Analytics 11.2 installed on Cloud Pak for Data 4.6, integrated with MAS 8.10, running on OCP 4.10
Dataset:
I will be using dummy elevators downtime data of a fictitious airport. Following are the features that the dataset includes,
- Code: Downtime Code, giving the reason for asset downtime
- Month: Month in which the downtime was reported
- Downtime: Downtime of the assets
- Service-Address: Service Address/Terminal of the airport
- Vendor: Manufacturer
Cognos Data Exploration:
Cognos Exploration is your key to unlocking the untapped potential of your data! Dive deep, analyze effortlessly, and uncover hidden gems with a single click. Create stunning interactive dashboards, slice, and dice data like a pro, and predict the future with advanced analytics. Collaborate, share, and revolutionize decision-making.
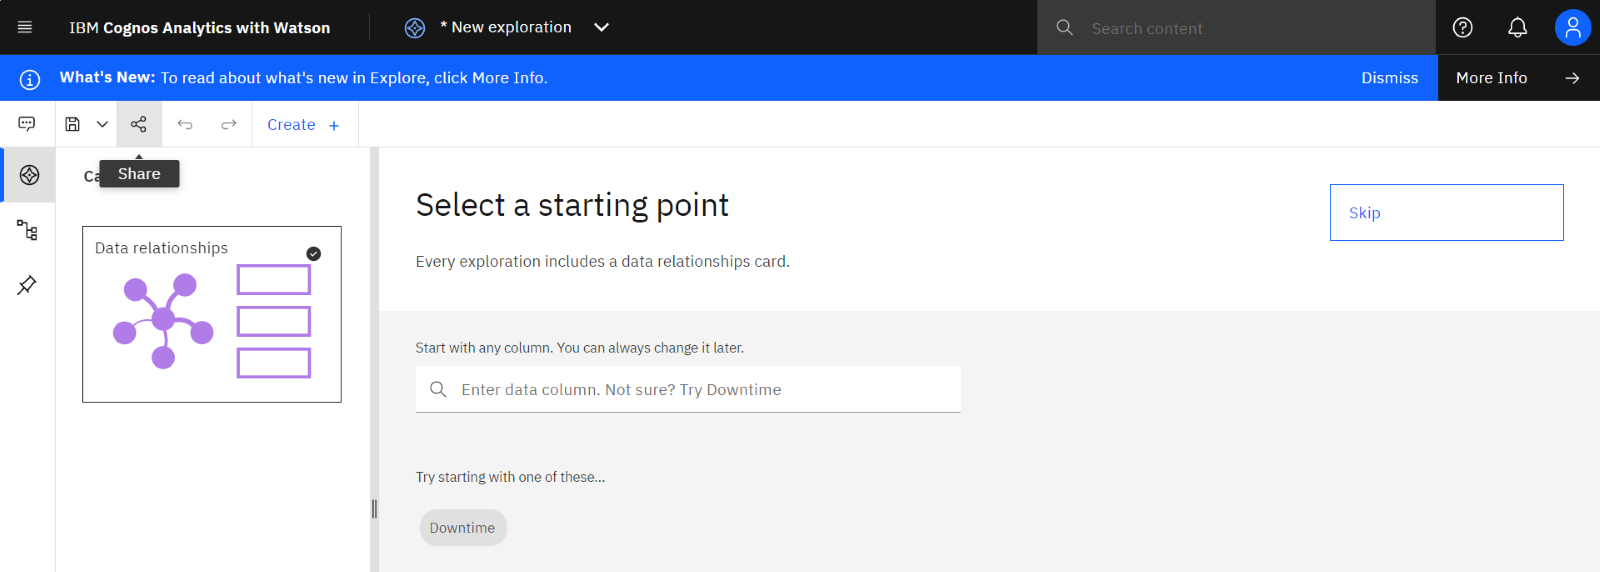
Let’s start by creating a new exploration for our dataset that I described above. We will analyze asset downtime and various factors affecting it.
Cognos instantly highlights the key features impacting downtime, showcasing their relative strength.
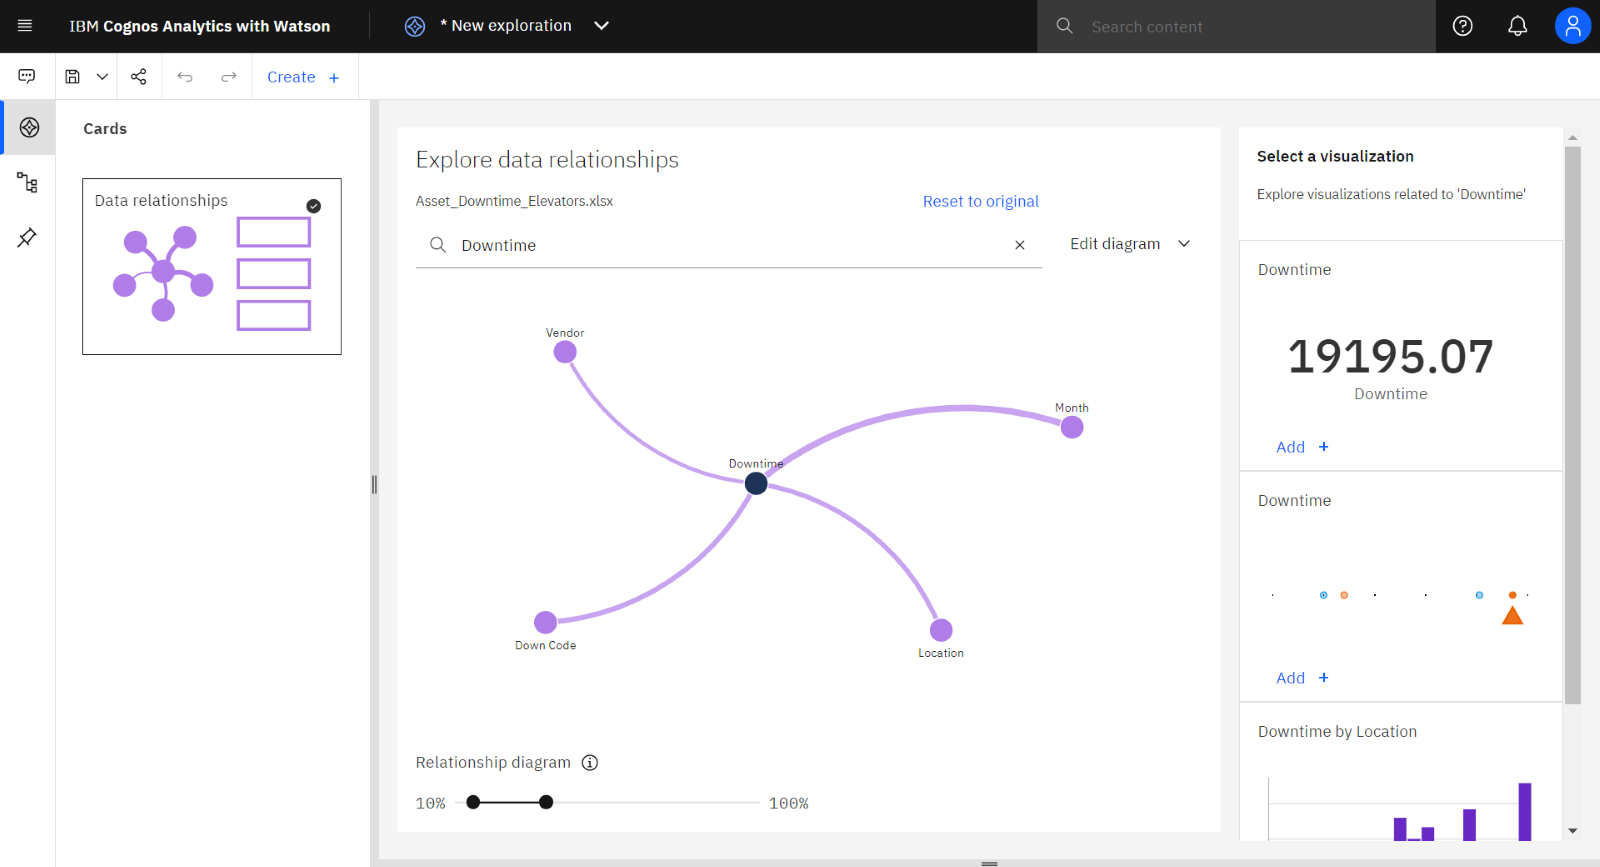
Cognos will also generate stunning visualizations on the right side for you to select and analyze the relationships in detail.
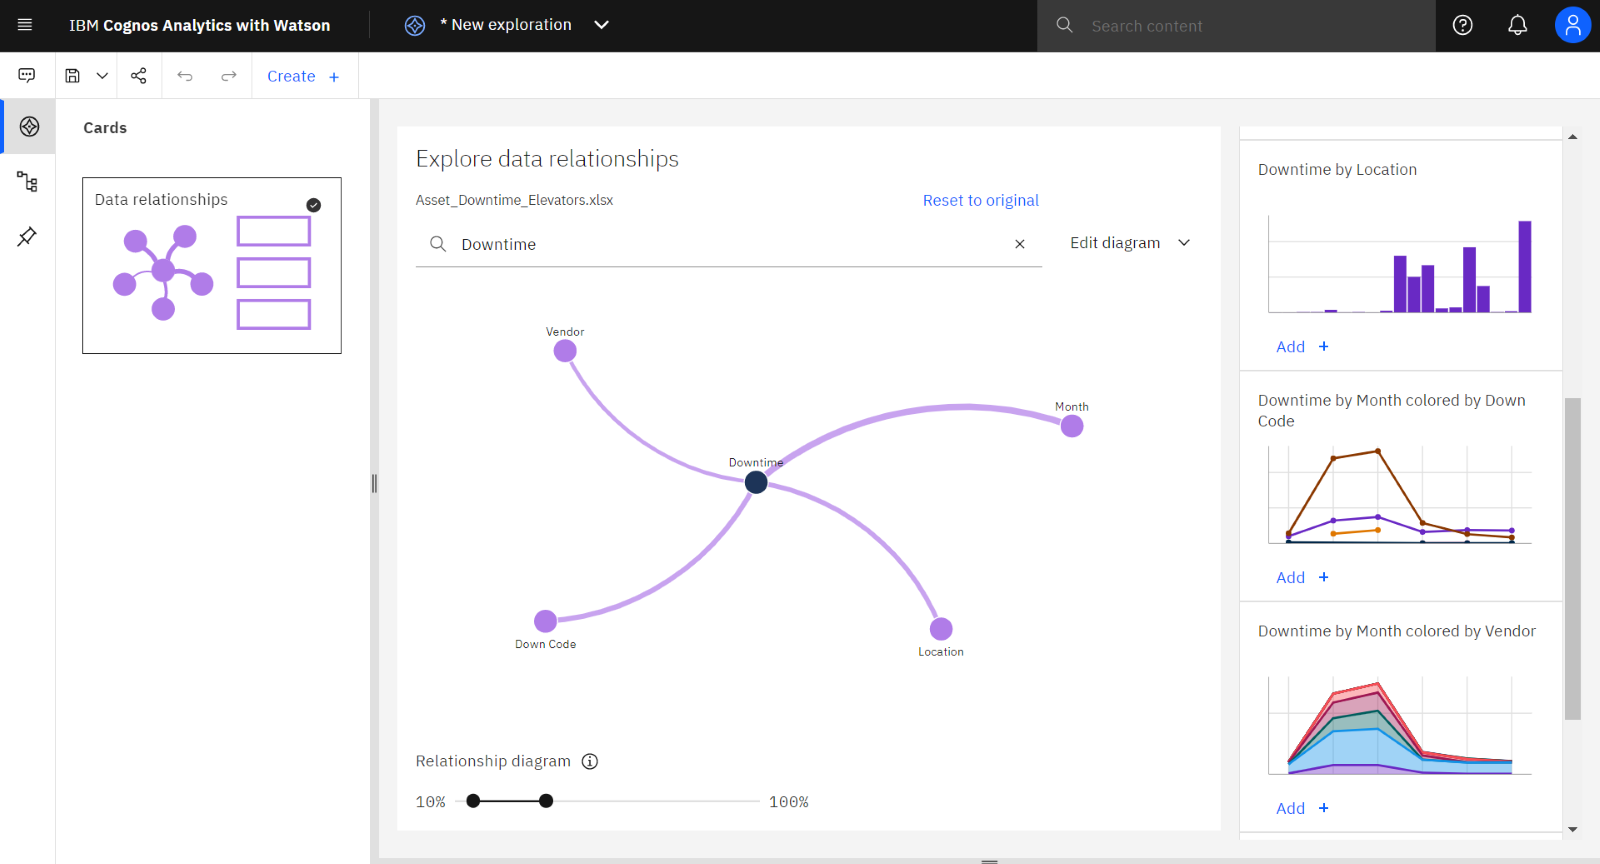
Simply select multiple features on the relationship diagram, and Cognos will generate the most suitable visualizations.
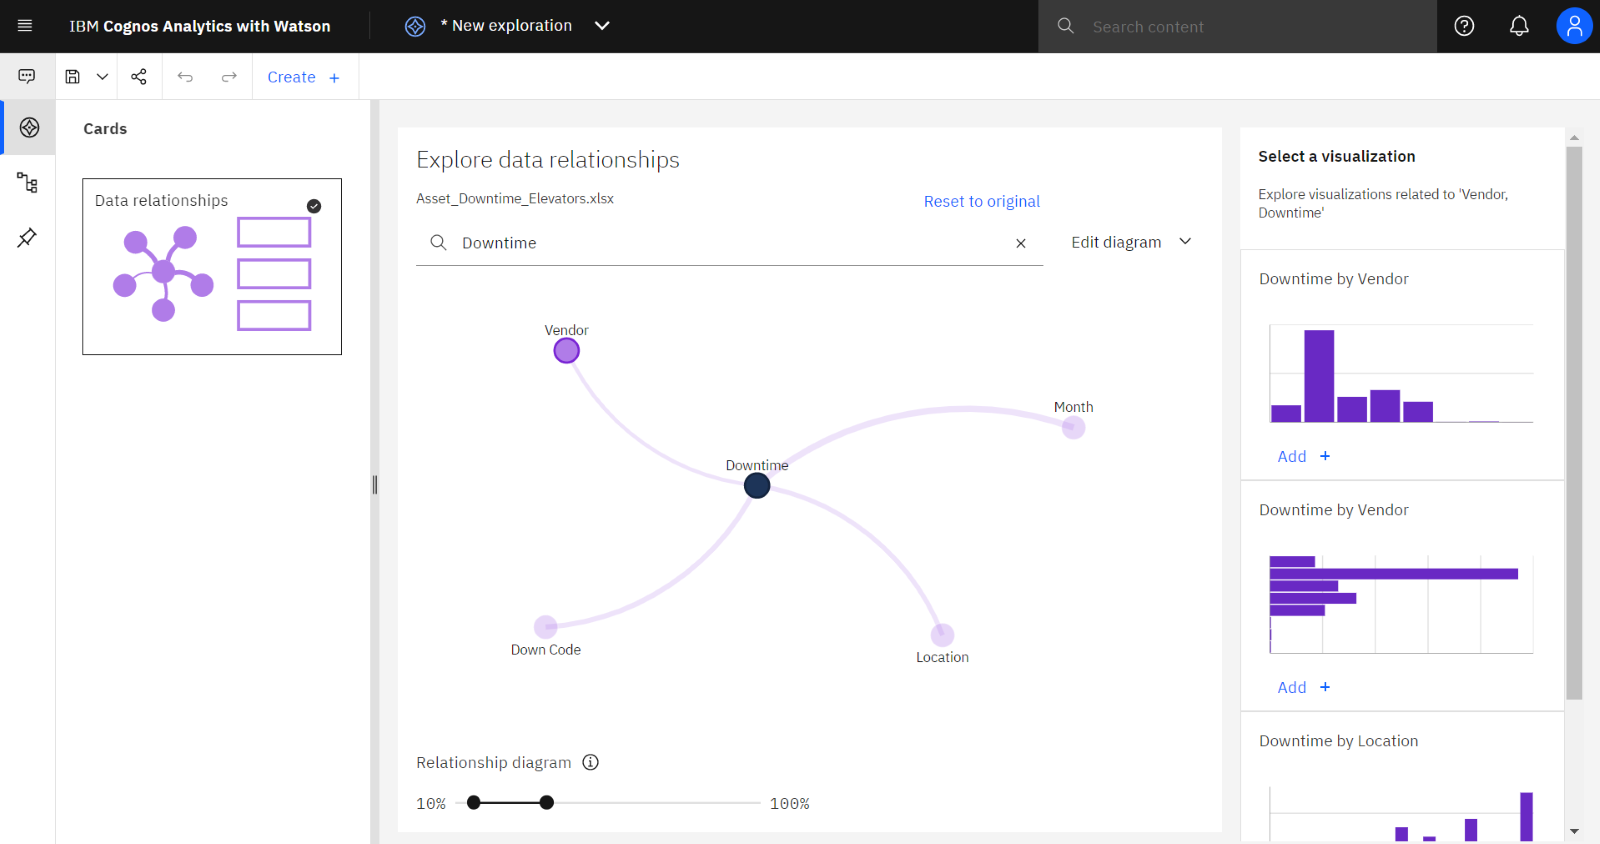
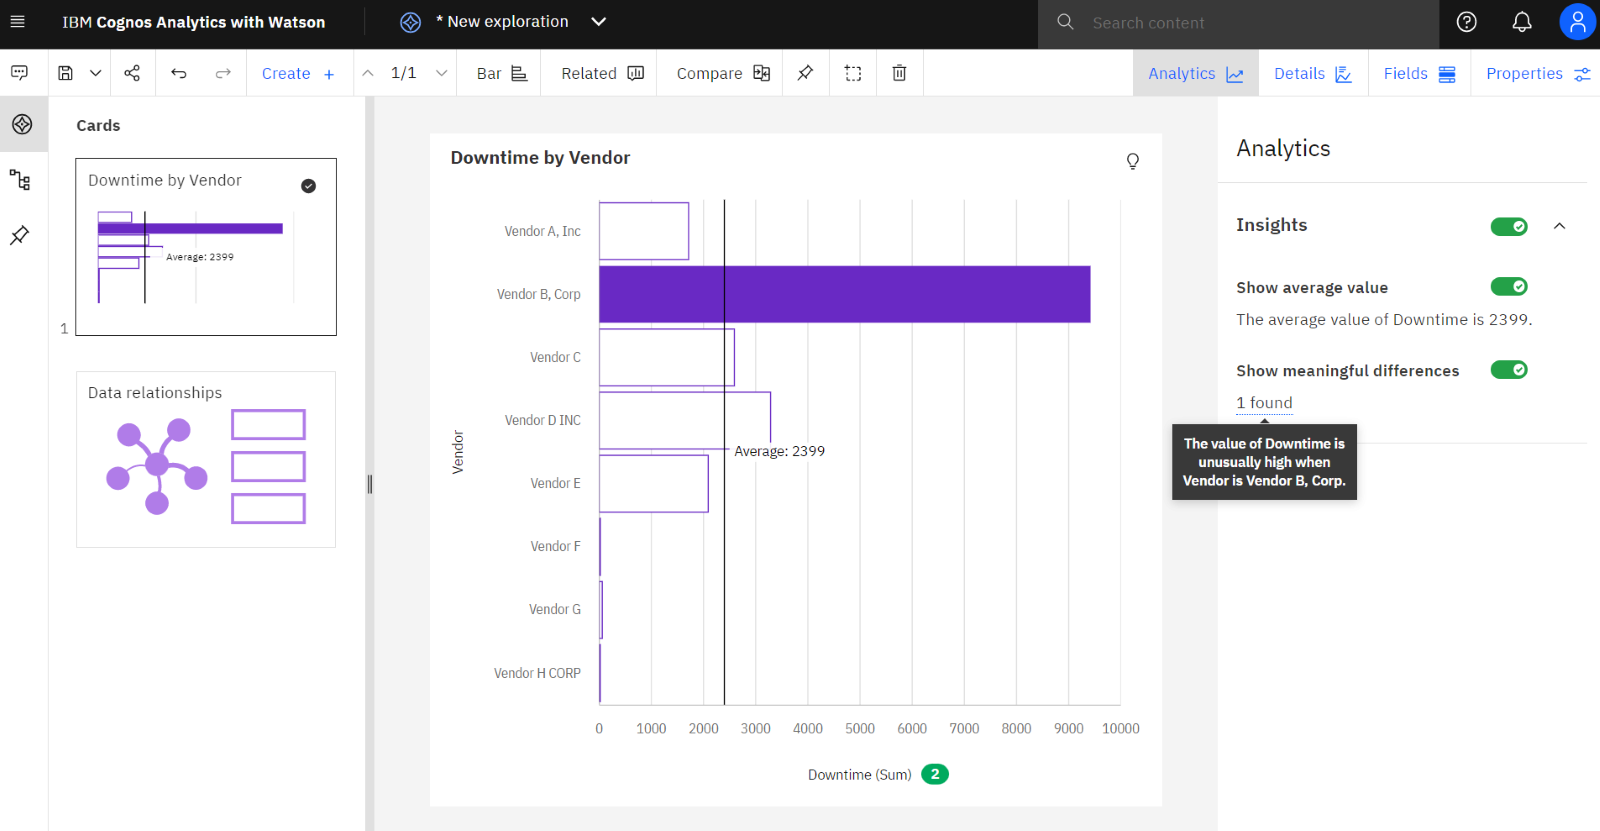
As you dive deeper into a chosen visualization, Cognos effortlessly highlights meaningful insights and differences. For example, we can observe that elevators belonging to Vendor B experience more downtime than others.
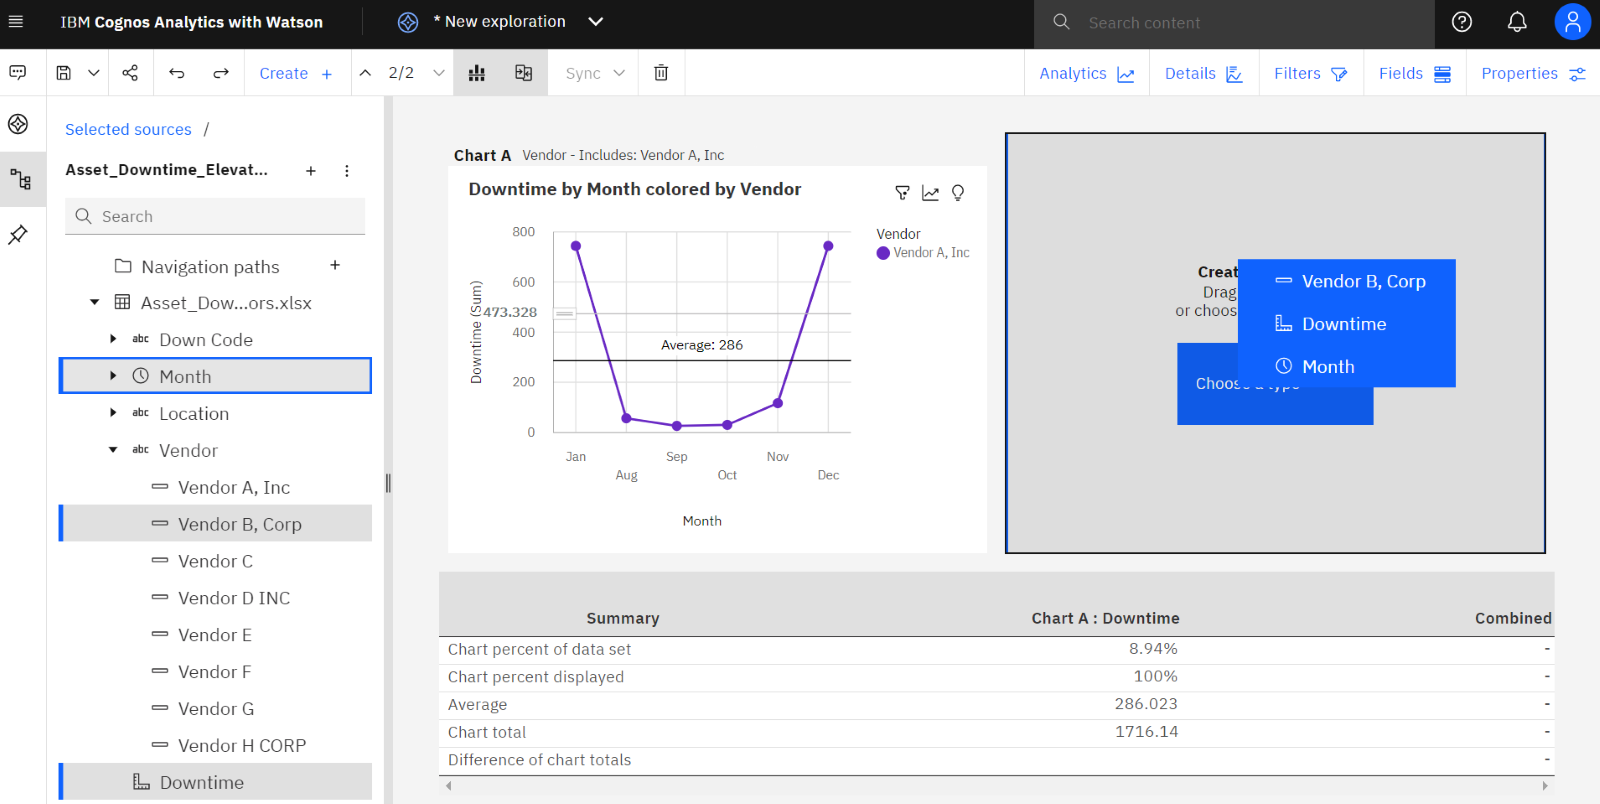
To slice and dice the downtime of Vendor B's elevators further, drag and drop Vendor B and any desired feature from the data source on the left. We notice higher downtime during the end and beginning of the year, suggesting failures during high-load holiday periods.
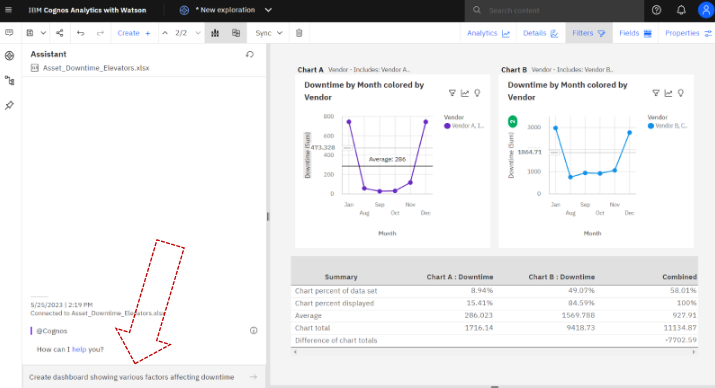
You can also use the comparison card to effortlessly compare downtime between any two vendors, as shown in the visualizations below.
Now, let's witness the power of Cognos Assistance's natural language processing. We simply asked the assistant to "Create a dashboard showing various factors affecting downtime."
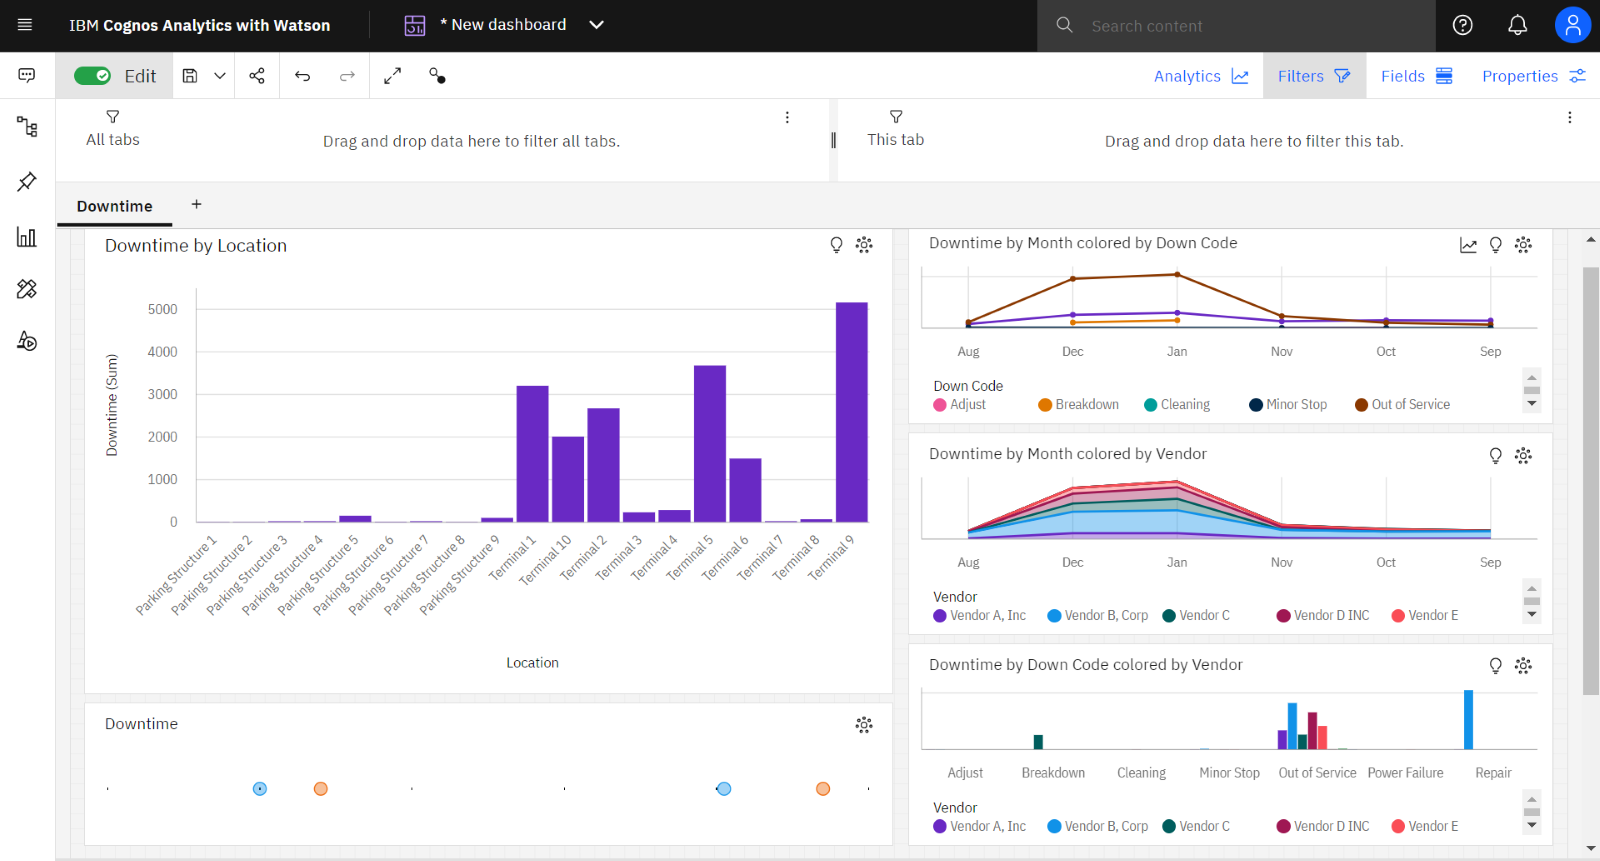
And there it is, a modern dashboard with captivating visualizations, revealing insights on the factors impacting downtime. All achieved by providing Cognos with a simple sentence in natural language.
As you embark on your journey with MAS and Cognos analytics with Watson, get ready to transform decision-making and uncover the extraordinary possibilities for reducing downtime and cost of asset maintenance.
With that, I will signoff for now. Stay tuned for more on many of the amazing features and functionalities that the Maximo Suite of Applications has to offer.