

I recently needed to diagnose out of memory problems with Maximo. There is some information in the Maximo logs that can help. Maximo can display mbo counts and free memory information. Maximo will also log the number of active users and when crons execute.
If the mxe.mbocount system property is set to 1, then Maximo will output a count of each MboSet type and the total number of those Mbos in the system every minute. It would look something like this: PERSON: mbosets (275), mbos (550).
Also every minute, Maximo will display the number of users connected to each instance
BMXAA6369I - Server host: 192.168.1.10. Server name: UI03A. Number of users: 9
and the total amount of memory available and used in the JVM
BMXAA7019I - The total memory is 2684354560 and the memory available is 633519896.
All this is useful information, but it can be hard to make sense of it by just looking at it as text in the log files. To help visualize it better, I created a web application to parse the logs and graph the data. It also gives the option of downloading the raw data so you can analyze the data yourself. The web application can be found at http://apps.thatmaximoguy.ca/maximologanalyzer/.
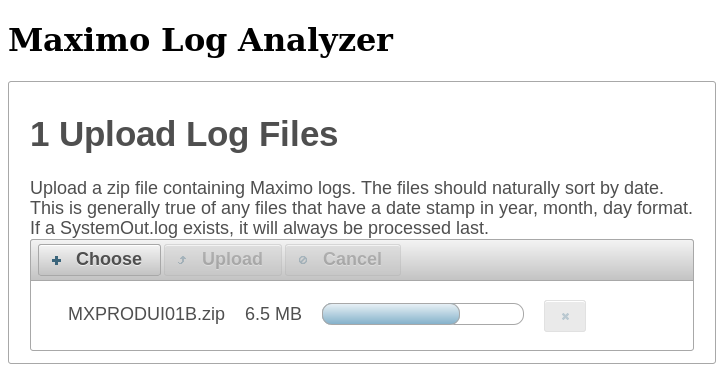
To use it, upload a zip file containing SystemOut logs.
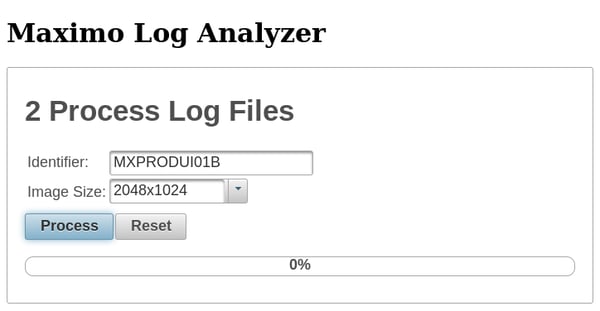
Once the file is loaded, specify an identifier to label the graph, the size you want the graphs, and click Process. It assumes that sorting the log filenames will place them in chronological order. This will be true if you are using the default SystemOut naming and log rotation. If you upload files that do not start with SystemOut, you will be prompted how to parse the date and time from the log file. This will follow Java’s SimpleDateFormat class.
Once the log files have been processed, you can view the graphs in your browser or download them along with the extracted data.
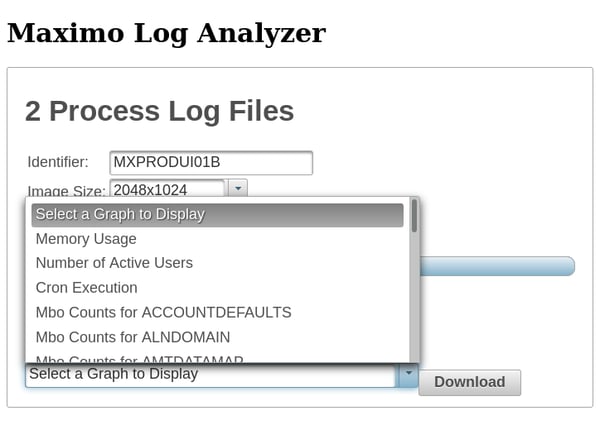
In addition to information about memory usage, the Log Analyzer can graph the number of active users and when crons execute.
While analyzing some logs, I ran into an interesting phenomenon as seen in the following graph.
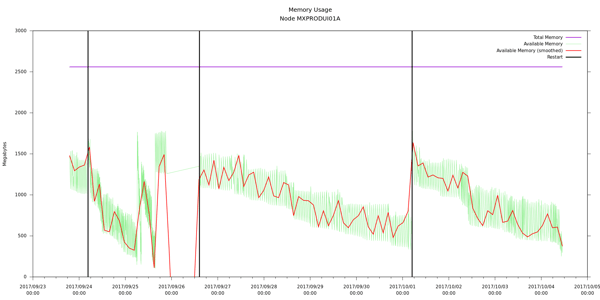
The total available is on a downward trend until each restart (black vertical line). Initially I would have said that this is an example of a memory leak. Identically configured sibling nodes did not show this trend. Deeper analysis showed that this node had actually been taken out of the cluster and hadn’t done anything for weeks. The sibling nodes that did process requests showed deeper drops in total available memory and higher peaks when memory was released. My interpretation is that there is a “laziness” to garbage collection: the JVM will release the easy stuff but won’t look any harder than it needs to.
Please contact Interloc with any questions you may have about the above post or to learn more about the consulting services and mobile solutions we provide.